
.png)
Conversion dropoff is one of the most expensive blind spots in digital businesses. While teams often focus on copy, design, or funnel structure, the root cause is frequently technical. Monitoring data reveals how performance issues directly influence user behavior and where conversion dropoff truly begins.
By combining observability with conversion rate optimization, teams can detect, explain, and reduce conversion dropoff before it impacts revenue.
Linking errors, delays, and timeouts to behavior
Real world data consistently shows that performance issues drive conversion dropoff. Google research found that as page load time increases from 1 second to 3 seconds, bounce rates increase by 32 percent. At 5 seconds, bounce rates increase by over 90 percent. These users do not complain, they simply leave.

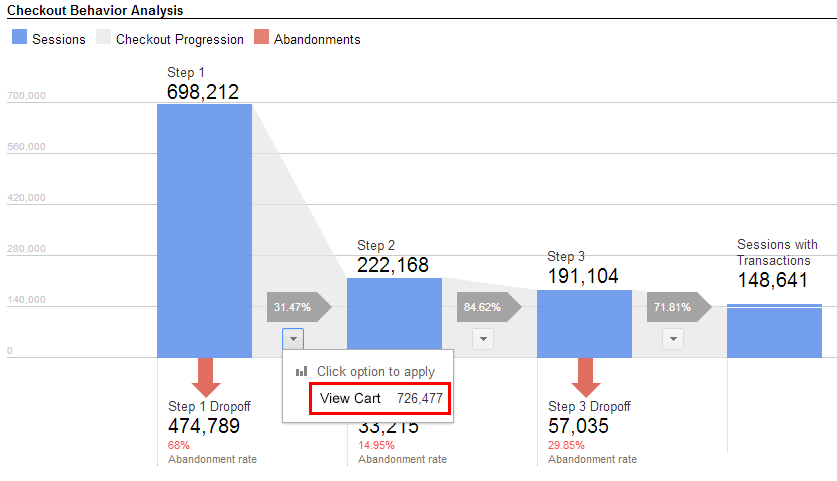
Monitoring tools surface these moments clearly. For example, an ecommerce brand noticed a 12 percent drop in checkout completion over two weeks. Monitoring data revealed a rise in payment gateway timeouts during peak hours. Each timeout added an average of 4 seconds to the checkout process, enough to push users to abandon.
Errors also create hidden friction. JavaScript errors on mobile devices often affect only a segment of users, making them easy to miss in aggregate analytics. Monitoring exposed one SaaS company to a login script failure affecting only Safari users, which explained a sudden 18 percent conversion dropoff on trial signups from iOS traffic.
Identifying technical friction before UX changes
Conversion dropoff is frequently misdiagnosed as a UX problem. Teams redesign pages, rewrite copy, or add trust badges, only to see minimal improvement. Monitoring data helps eliminate guesswork.
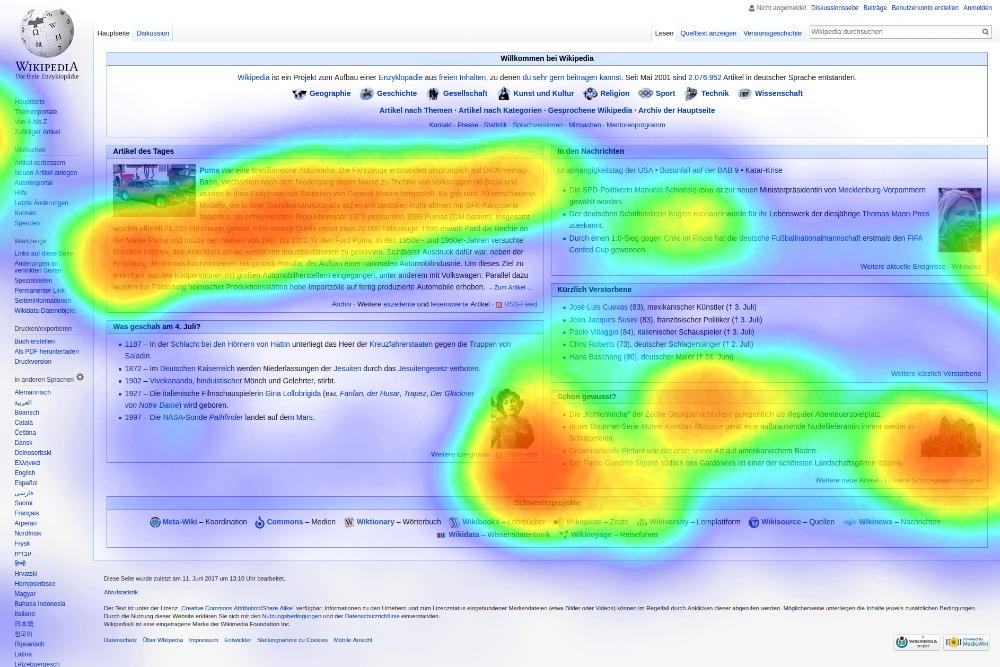
A subscription business experienced declining upgrades from free to paid plans. Heatmaps looked normal and surveys showed no obvious objections. Monitoring revealed intermittent API failures when loading pricing tiers, causing incomplete page renders for about 7 percent of users. Fixing the API reduced conversion dropoff by 22 percent without any UX changes.
Technical friction often includes:
- Third party scripts delaying page interactivity
- Browser specific rendering errors
- Backend slowdowns during traffic spikes
- CDN cache misses increasing load time
Addressing these issues first prevents unnecessary redesigns and accelerates recovery.
Patterns that precede conversion loss
Conversion dropoff rarely happens overnight. Monitoring data exposes early warning signs that appear well before analytics dashboards show a decline.
Common leading indicators include:
- Gradual increases in time to first byte above 500 ms
- Error rates climbing above 1 percent on key endpoints
- CPU or memory usage steadily increasing during high traffic periods
- Third party service latency increasing week over week
One marketplace observed that when average search response time exceeded 800 ms for more than three days, conversion dropoff followed within a week. Once identified, this pattern became a proactive trigger for infrastructure scaling, preventing future losses.
These patterns allow teams to shift from reactive troubleshooting to predictive optimization.
Turning alerts into optimization actions

Monitoring alerts are often treated as engineering noise. High performing teams connect alerts directly to business metrics, including conversion dropoff.
For example, a checkout latency alert should immediately prompt:
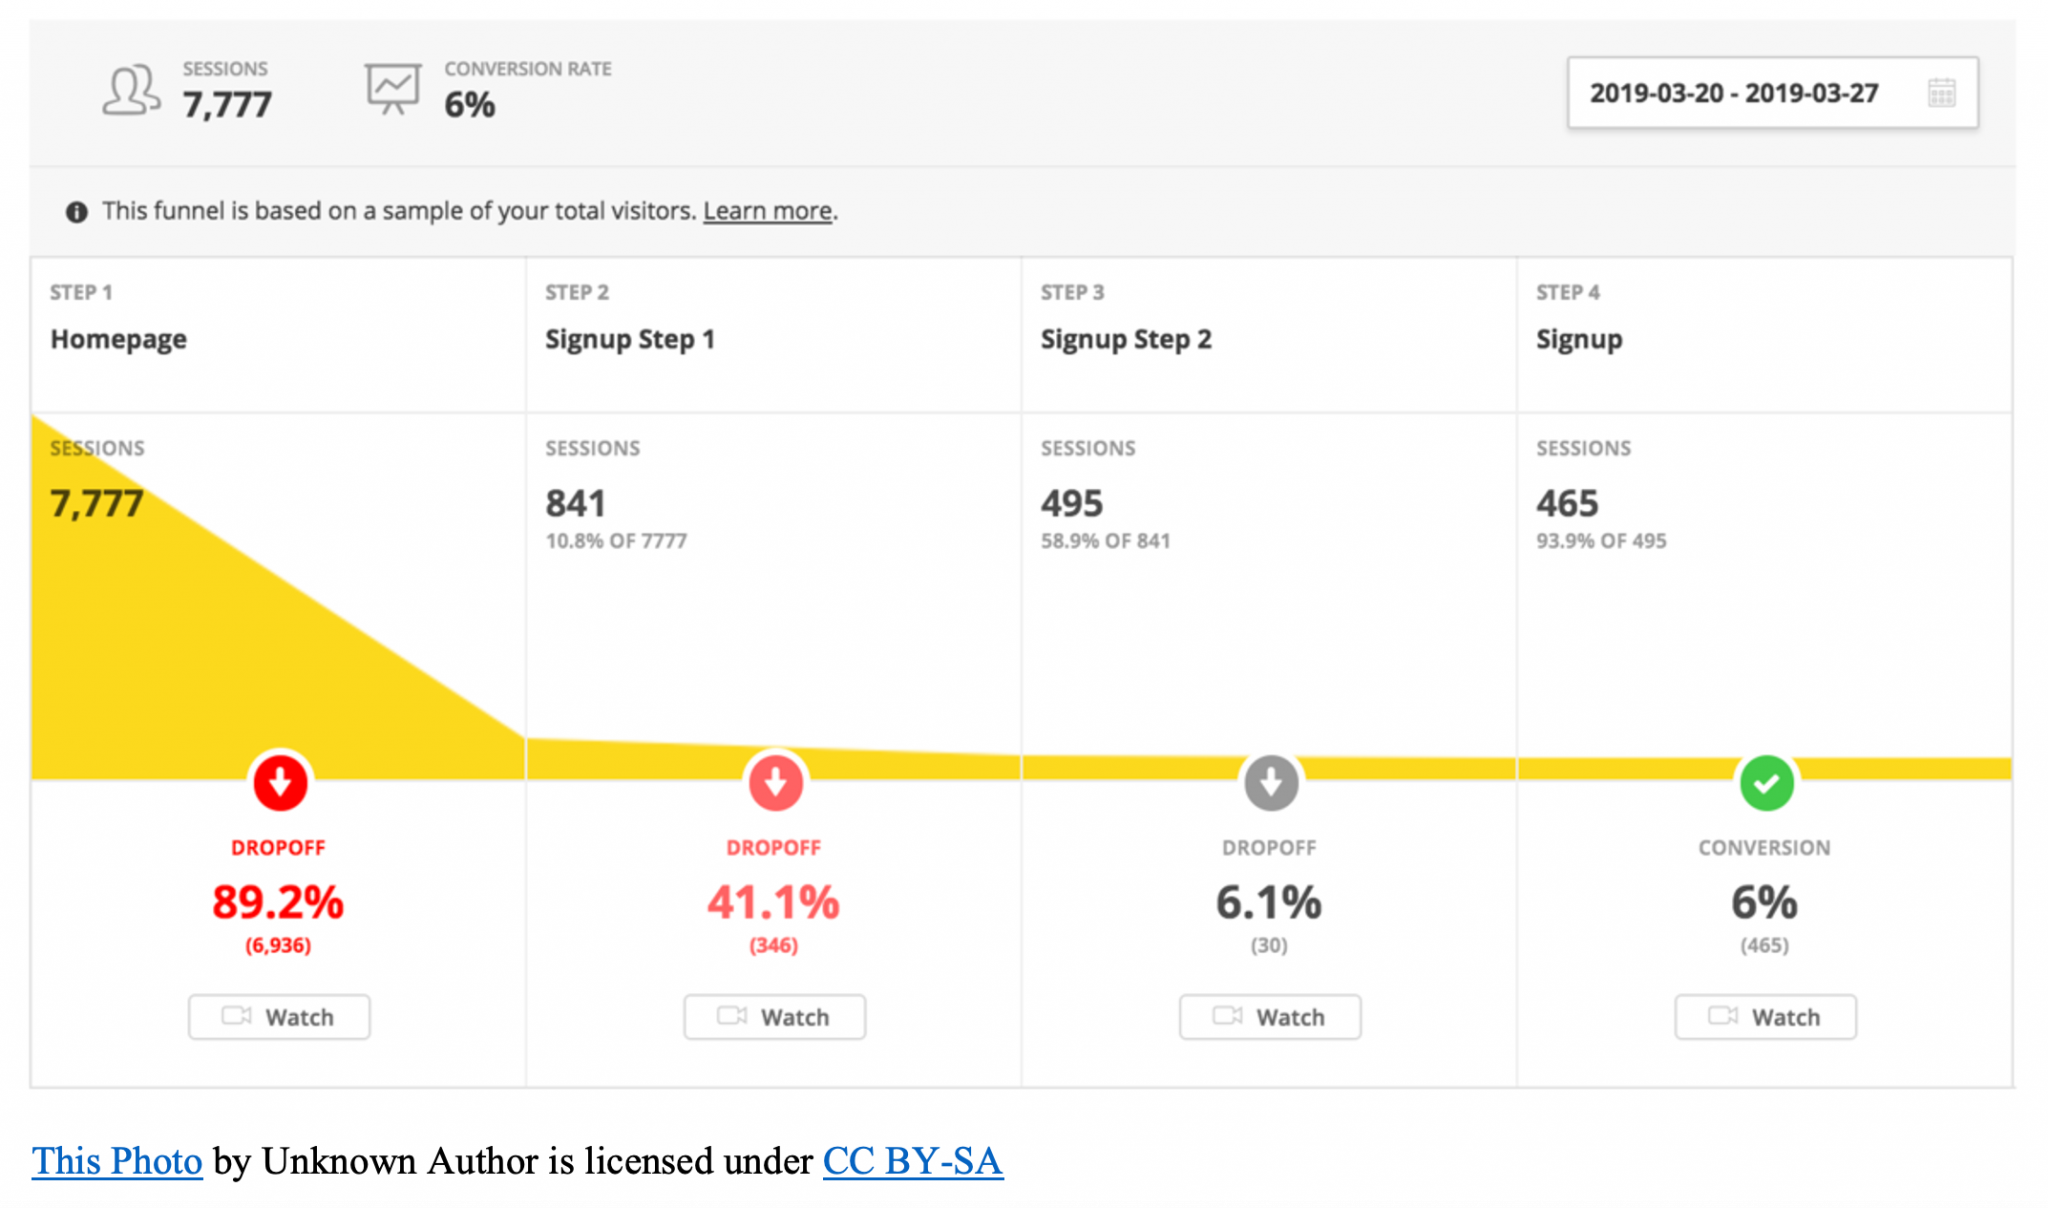
- A funnel review to identify where users are exiting
- A session replay analysis for affected users
- A temporary experiment such as simplifying the checkout flow during incidents
An ecommerce retailer implemented alert thresholds tied to revenue impact. When checkout response time exceeded 2 seconds, an alert triggered both engineering and growth teams. This process reduced average incident related conversion dropoff by 30 percent within three months.
Alerts become more valuable when they answer a business question, not just a technical one.
Closing the loop between monitoring and CRO
The most effective organizations treat monitoring as an input to CRO, not a separate function. Monitoring explains why conversion dropoff occurs. CRO validates which fixes actually restore performance and revenue.
A SaaS company used monitoring data to identify that slow onboarding flows correlated with trial abandonment. CRO experiments then tested simplified steps and preloaded data after performance fixes. The combined approach increased trial to paid conversions by 17 percent.
Closing the loop means:
- Using monitoring data to form CRO hypotheses
- Validating fixes with controlled experiments
- Feeding CRO results back into alert thresholds and performance budgets
When monitoring and CRO work together, conversion dropoff becomes measurable, manageable, and scalable.
Why monitoring data matters for SEO and revenue
Search engines increasingly factor page experience and performance into rankings. Slow pages not only cause conversion dropoff, they reduce organic visibility. Monitoring data helps protect both traffic and conversions by ensuring performance standards are consistently met.
Reducing conversion dropoff through technical optimization improves:
- User engagement signals
- Core Web Vitals
- Funnel completion rates
- Revenue per visitor
Connect monitoring data, performance insights, and conversion optimization into one clear growth system. See how technical signals translate into measurable revenue impact at Cromojo.