
.png)
In the rapidly evolving digital world, gaining a clear understanding of how users truly experience your web and mobile applications is essential. Real User Monitoring (RUM) provides a powerful method to achieve this by capturing performance metrics and user behavior in real time, directly from the devices and networks your audience uses. Unlike synthetic monitoring, which depends on simulated tests, RUM offers a direct view of actual user interactions, enabling you to detect performance bottlenecks and enhance application performance based on real-world data. This article delves into what real user monitoring entails, its significance, how to integrate it into your processes, and the concrete benefits it delivers for improving user satisfaction and business results.
The following sections will outline the primary advantages of real user monitoring and how it can add strategic value to your organization.
Understanding What RUM Is
Real User Monitoring, commonly known as RUM, is a technique that gathers data on how genuine users experience your digital platforms and web properties during their interactions with your application. RUM collects interaction data from user engagement, capturing events, logs, and metrics to monitor real user experiences and boost application performance. It tracks a variety of performance metrics such as page load time, core web vitals, JavaScript errors, HTTP requests, web pages, and other key indicators that affect user experience. RUM observes how users engage with web pages or applications, monitoring actual user interactions and user sessions on their devices, operating systems, and network conditions, to provide a comprehensive view of application performance in real environments.
This method stands in contrast to synthetic monitoring, which uses scripted tests executed from controlled environments like data centers to simulate user journeys. While synthetic monitoring is useful for establishing baselines and performing regression tests under ideal conditions, it cannot capture the diversity of real user environments. For instance, synthetic tests won’t reveal how your app performs on mobile devices with slow network connections or outdated browsers, making it vital to consider the user's device for precise insights.
RUM tools deliver valuable insights by exposing the subtleties of real user experiences, whether users navigate your single-page applications seamlessly or face slow load times caused by backend services or resource allocation challenges. By collecting real-time data on user behavior and performance issues, real user monitoring provides actionable intelligence that helps optimize application performance and improve user experiences across varied user groups.
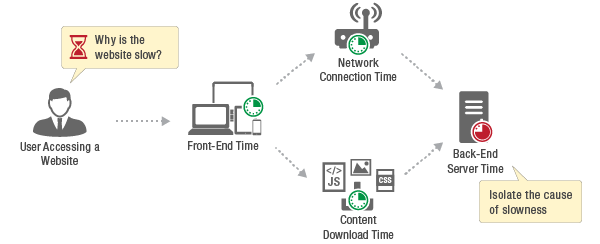
Why RUM Changes the Way You See Performance
The main advantage of real user monitoring is that it shifts the focus from theoretical performance benchmarks to actual end-user experience. Instead of relying on synthetic tests that suggest your web page loads quickly, RUM reveals the real friction points users encounter. For example, a page loading in 1.5 seconds in internal tests might take 4 seconds for mobile users in regions with slower networks.

Additionally, RUM helps you understand the scope and impact of performance bottlenecks by showing how many active users are affected and their locations. Performance issues on rarely visited pages are less critical than those affecting business-critical user actions like checkout or login. This prioritization enables teams to allocate resources efficiently to address the most significant problems first.
Over time, analyzing user interactions through RUM data uncovers trends and patterns. You can see how new features, third-party scripts, or infrastructure changes affect user engagement and satisfaction. For example, spikes in JavaScript errors or slow load times may correspond with increased bounce rates or drop-offs during crucial parts of the user journey. Such insights are difficult or impossible to obtain from synthetic monitoring alone.
Core Web Vitals and Performance Data
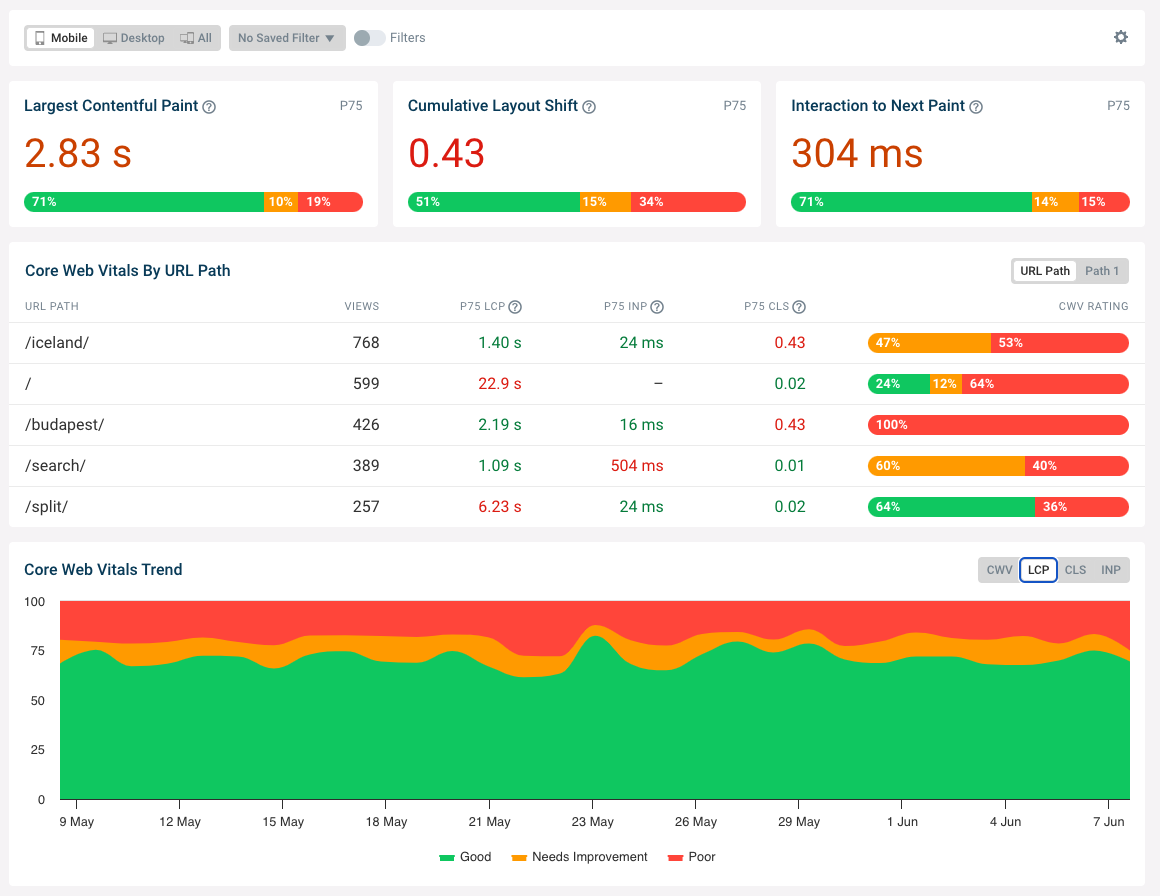
Real User Monitoring revolutionizes the understanding and optimization of true user experience on digital platforms. A key strength of RUM is its ability to provide deep insights into core web vitals and other performance metrics that directly influence how users interact with your web and mobile applications.
Core web vitals, defined by Google, measure page load time, interactivity, and visual stability through metrics like Largest Contentful Paint (LCP), First Input Delay (FID), and Cumulative Layout Shift (CLS). By leveraging RUM tools, organizations can observe how these metrics perform under real-world conditions across devices, browsers, and network speeds.
Beyond core web vitals, RUM tools capture performance data such as JavaScript errors, HTTP requests, resource usage, and user engagement. This data allows teams to analyze interactions in real time, uncovering performance bottlenecks invisible to synthetic monitoring. Continuous analysis enables rapid responses to issues, supports better prioritization of optimization efforts, and ensures smoother experiences for users.
RUM is particularly effective for single-page and mobile applications with complex journeys. Tracking real user sessions helps pinpoint usability issues and focus optimization on scenarios that matter most. Combining RUM with synthetic monitoring gives a complete view of performance, synthetic tests define expectations, while RUM confirms how those expectations hold up in reality.
Bringing Real User Monitoring Tools into Your Workflow
Incorporating real user monitoring into your performance management workflow is straightforward with modern RUM solutions. Most tools provide scripts or SDKs that collect valuable data on user actions and performance directly within your applications.
To maximize its value, collect meaningful metrics like first contentful paint, time to interactive, and navigation timing, along with contextual data about the user’s environment. Make reviewing RUM data a regular part of your development cycle. After each release, examine performance trends, set alerts for regressions, and track improvements. When integrated into daily workflows, RUM becomes a continuous feedback mechanism for both engineering and UX teams.
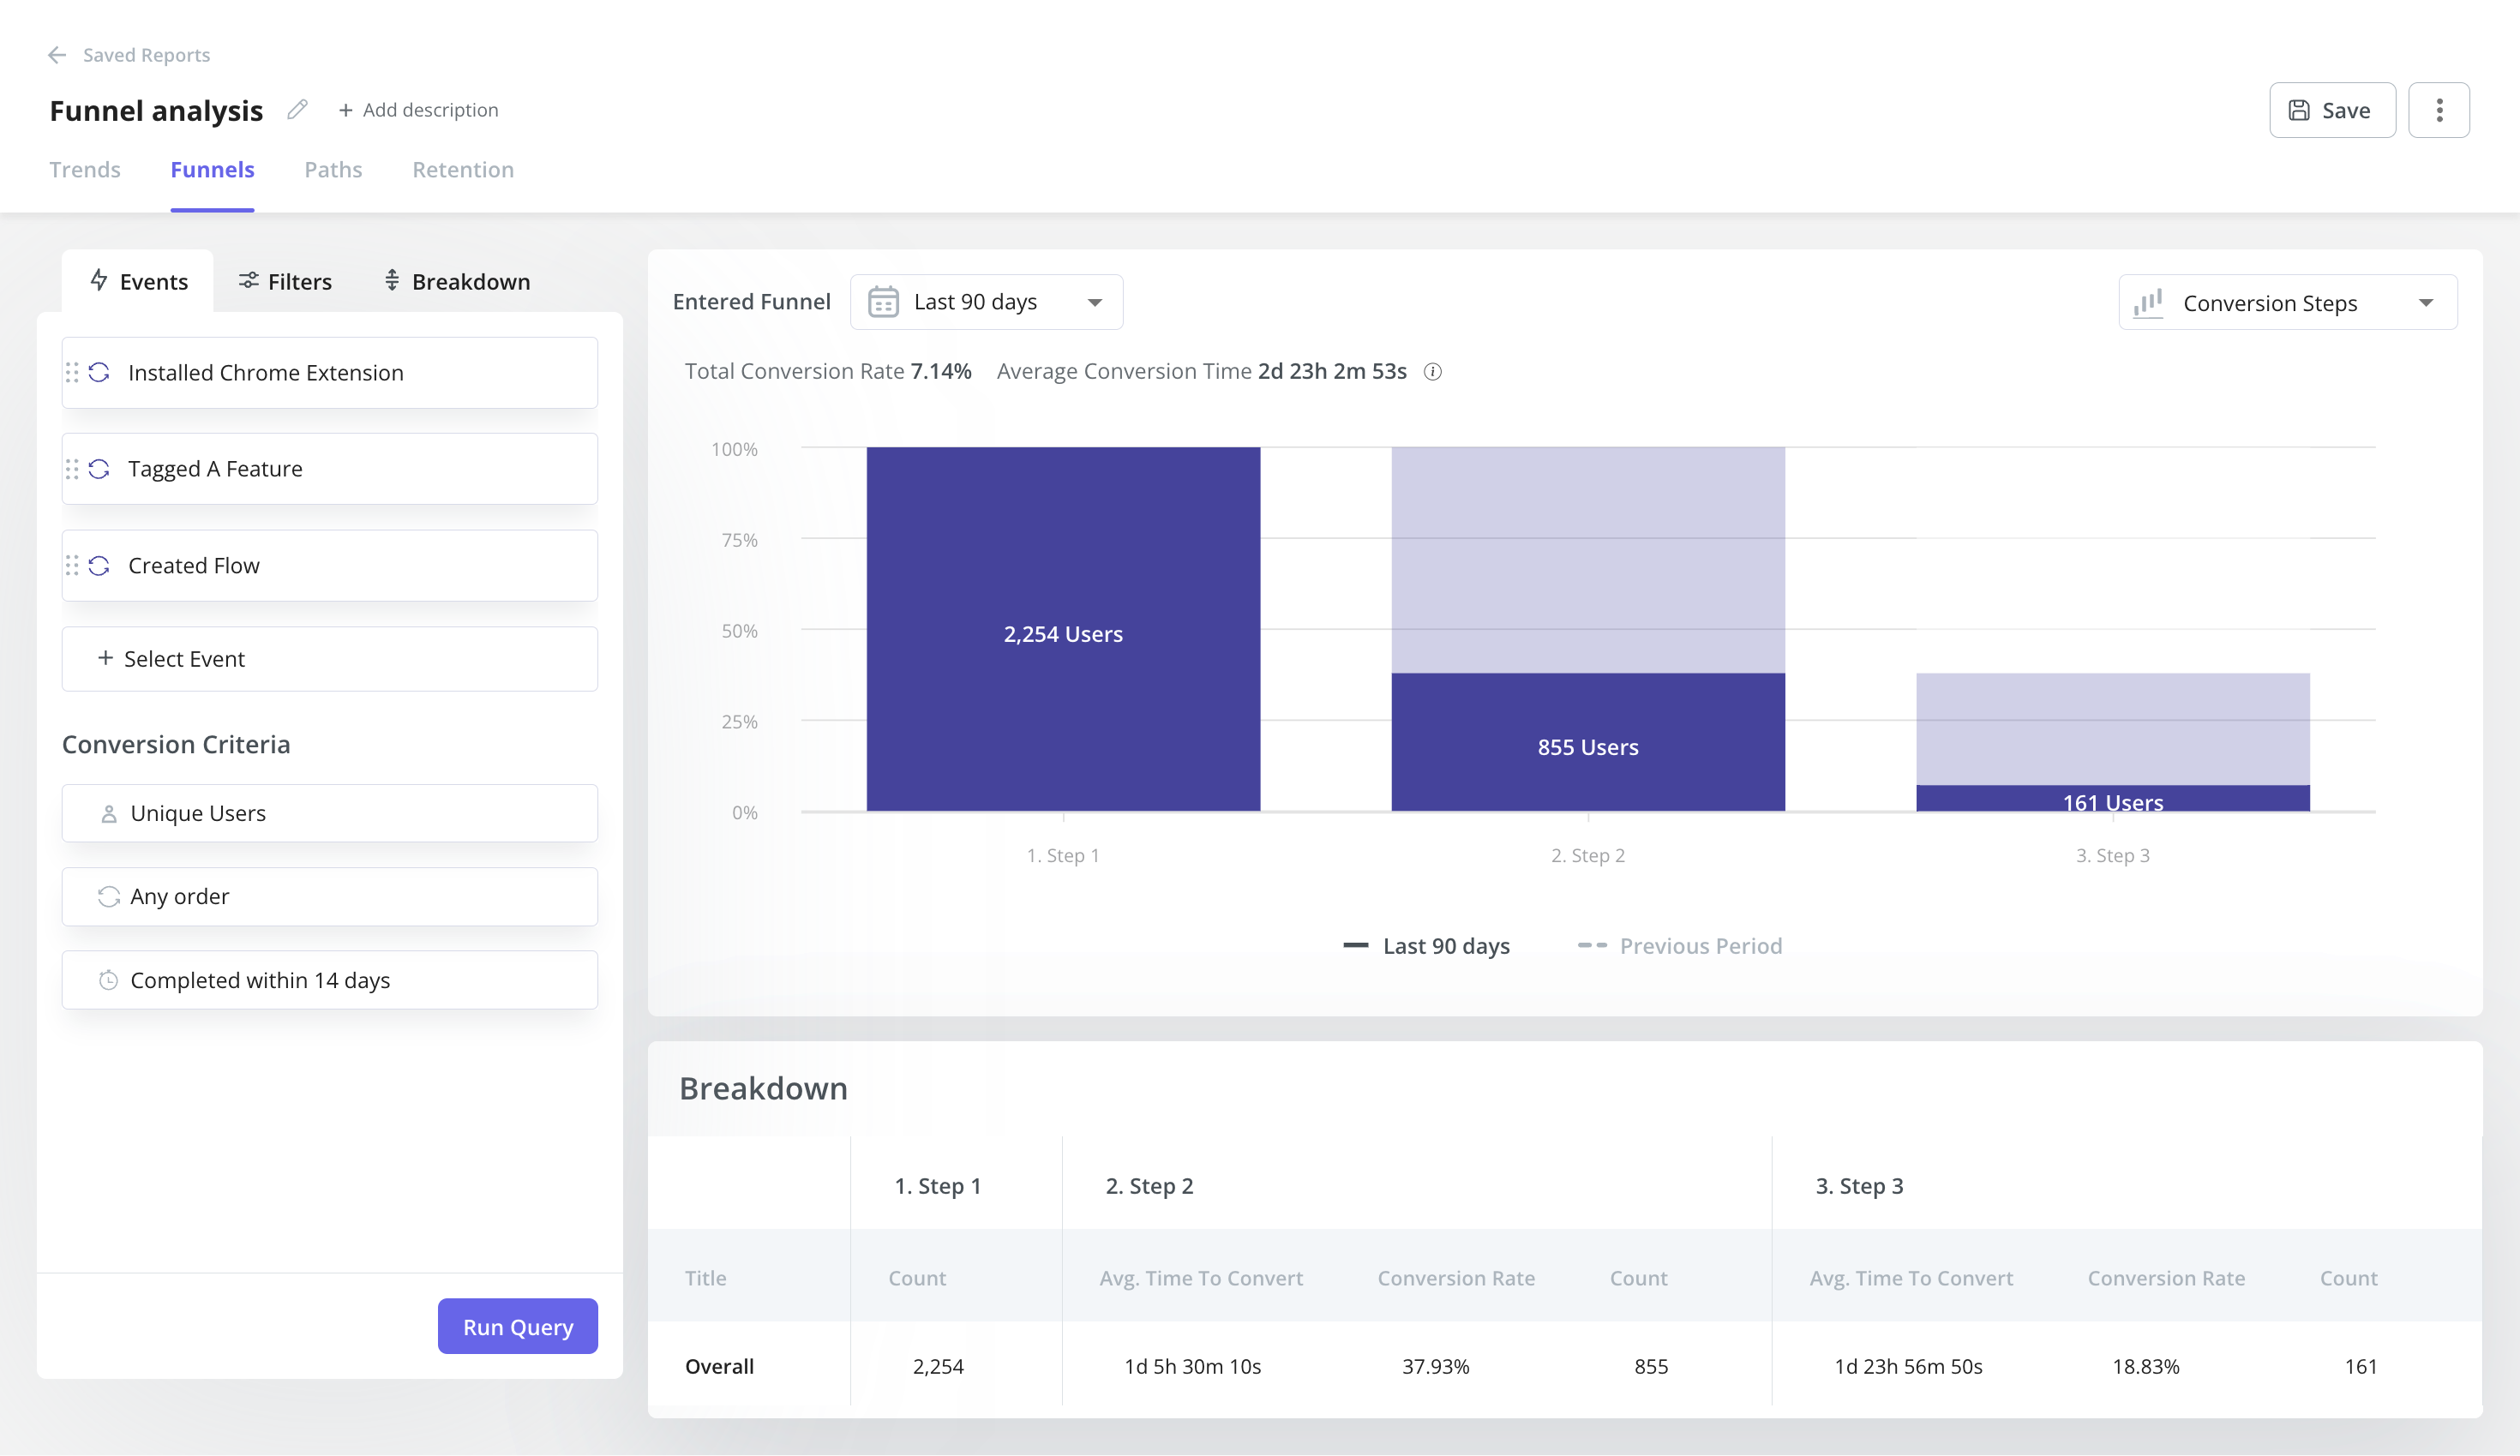
Turning Data into UX Decisions
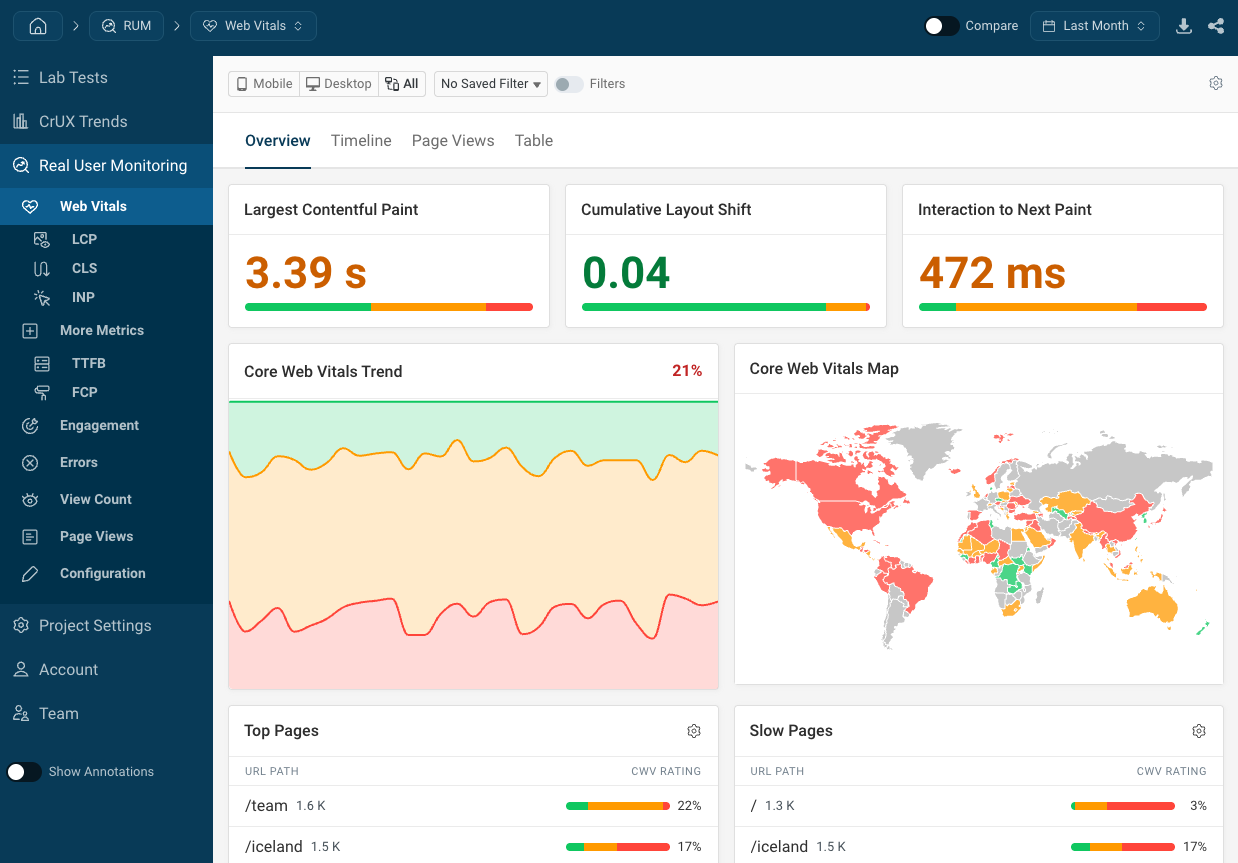
Collecting RUM data is only the start; its real power comes from how you interpret and act on it. Averages can hide poor experiences that occur for users at higher percentiles. Segmenting performance data by device, network, or region reveals which users face the greatest friction.
When correlated with business outcomes like conversions and bounce rates, RUM data turns technical performance metrics into tangible insights about user behavior. This connection helps prioritize the most impactful optimizations and drives better ROI from performance work. It also closes the feedback loop, each optimization can be validated by observing its effect on real users immediately after deployment.
A Practical Example
Consider a SaaS company that relied solely on synthetic monitoring. Their tests consistently reported load times under two seconds, yet customers in Southeast Asia complained about slow checkout experiences. Once they introduced real user monitoring, they discovered the issue affected mobile users with slower networks, data that synthetic monitoring had completely missed.
After acting on these insights and optimizing asset loading, the company reduced load times by nearly a second for affected users. Checkout abandonment dropped by 15 percent, and satisfaction scores improved significantly. RUM gave them visibility into issues they never knew existed and the data to fix them effectively.
The Bigger Picture
Real user monitoring is more than a technical tool; it’s a strategic enabler. It aligns engineering, UX, and business objectives around the shared goal of improving real user experience. By capturing the full spectrum of interactions and performance data, RUM empowers teams to move from guesswork to evidence-based decision-making. Organizations that adopt RUM gain a powerful lens into user behavior, enabling proactive optimization, better resource allocation, and stronger customer engagement.
Power Your UX Strategy with Cromojo
If you’re ready to see your application the way your users do, Cromojo Real User Monitoring can help. Cromojo captures live performance data directly from user sessions, revealing real-world insights into how your app performs across devices, networks, and regions. With Cromojo, you can move beyond synthetic metrics, identify hidden performance bottlenecks, and make data-driven improvements that actually enhance user satisfaction.
Start delivering faster, smoother experiences today, explore Cromojo Real User Monitoring and unlock the full potential of your UX strategy.
.png)
.png)
.png)