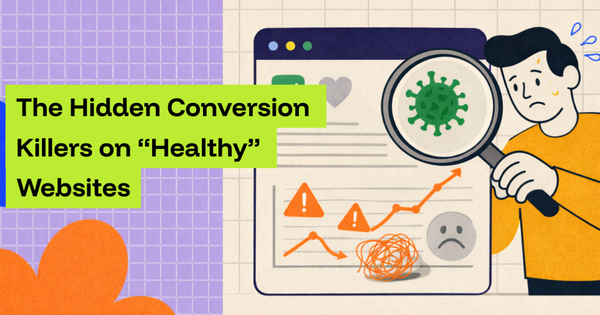
When your website goes down, it’s not just a technical hiccup, it’s a trust problem, a revenue leak, and an SEO setback. Both marketers and developers need to understand uptime monitoring, not just as a technical safeguard but as a business-critical practice. Let’s walk through why uptime matters, how to set up monitoring properly, and how to avoid the common pitfalls.
Why uptime matters for SEO and user trust
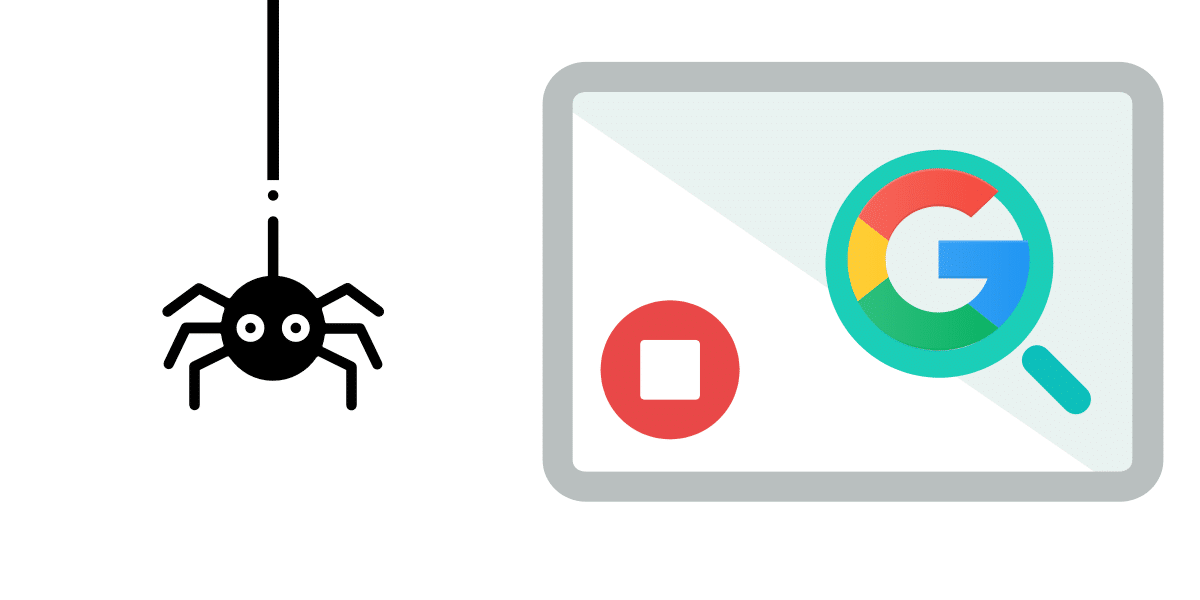
Search engines like Google crawl and index your site regularly. If they encounter errors (such as repeated downtime or server unavailability), your rankings can suffer. Google won’t recommend a site it can’t reliably access.
From a user perspective, the stakes are even higher. Imagine clicking on an ad, an email link, or a social post, only to find a dead site. Users rarely return after a bad experience. A single hour of downtime during peak traffic could mean thousands in lost revenue, not to mention the erosion of brand credibility.
A practical example: Amazon is famously known to lose millions of dollars per hour when their site goes down. While your business may be smaller, proportionally, downtime can sting just as much.
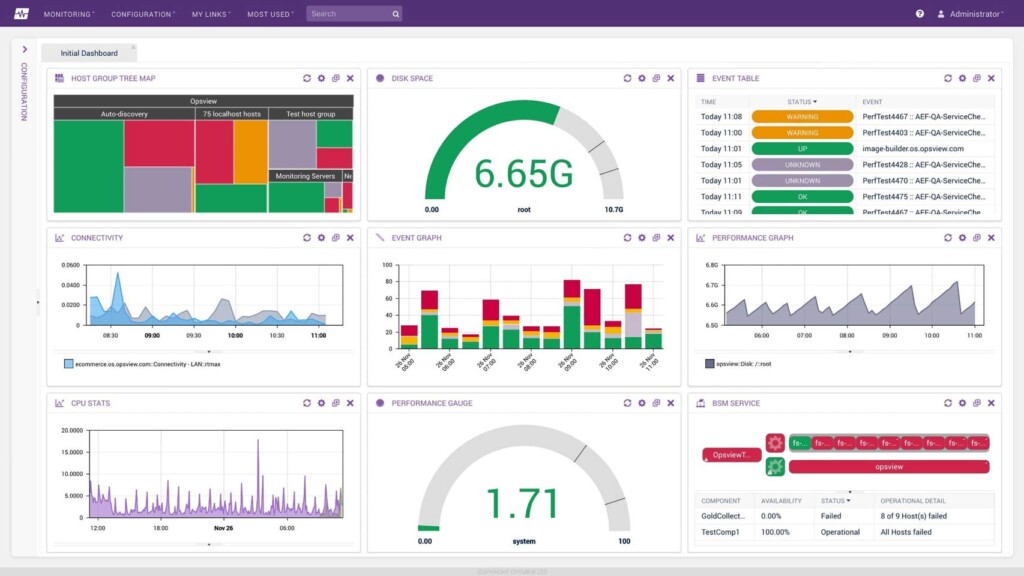
Internal Monitoring: Behind-the-Scenes Watchdog
Internal monitoring is like your restaurant’s kitchen inspection. It checks whether the stove is working, ingredients are stocked, and the chef is at the station.
In website terms, this means monitoring the components inside your infrastructure:
- Web server health – e.g., Apache or Nginx process status.
- Database availability – ensuring MySQL or PostgreSQL is running and responding.
- API services – confirming background services like payment gateways or authentication systems are alive.
- Resource usage – monitoring CPU, memory, disk space, or even SSL certificate validity.
Example:
Imagine you run a SaaS app. Your internal monitoring may flag that the database CPU usage has spiked to 95%. The public website is still loading, but queries are slowing down. Without this internal alert, your team might not catch the brewing issue until users start complaining about sluggish dashboards.
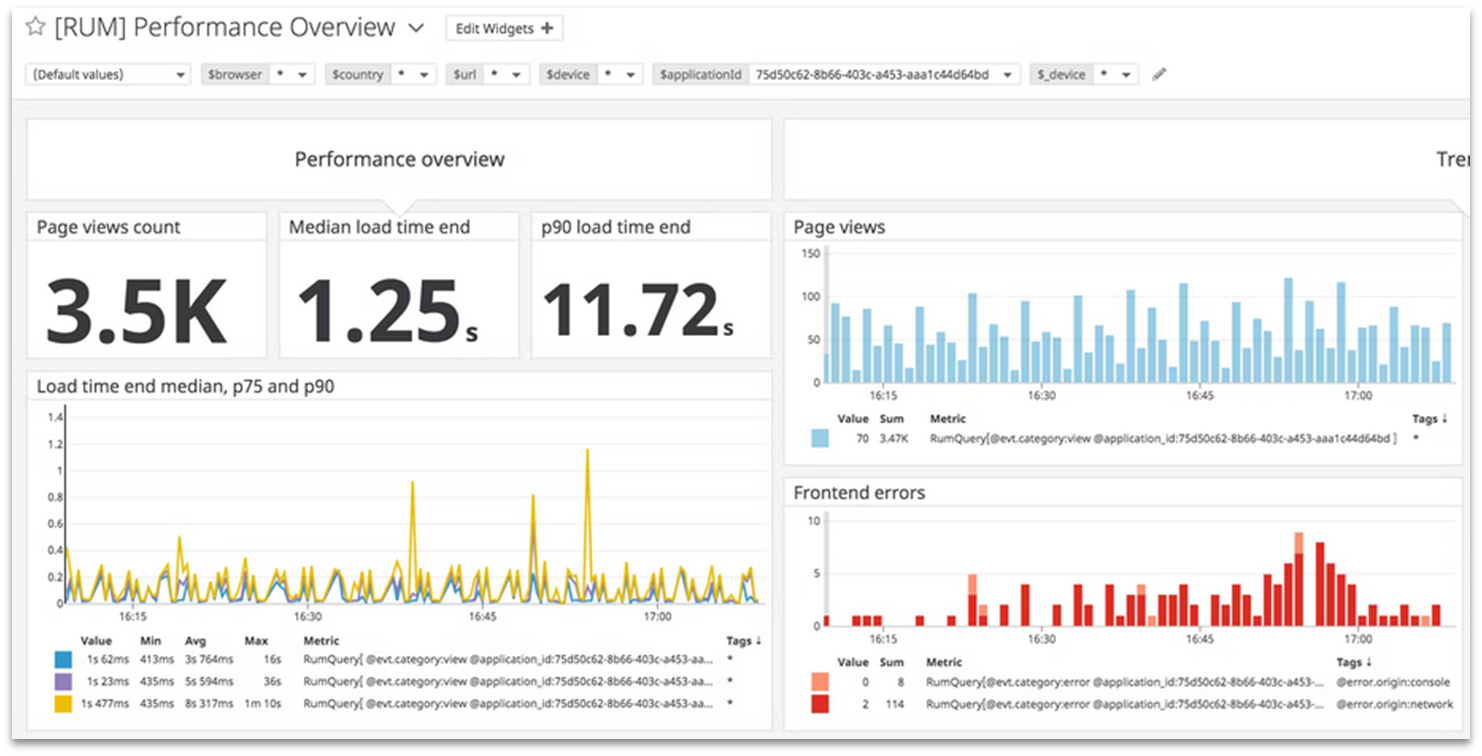
External Monitoring: Customer’s Point of View
External monitoring simulates the experience of a real user visiting your site. Instead of asking “Is the server up?”, it asks “Can I load the homepage from New York? What about from Singapore?”
It checks:
- Page availability – Does the homepage load without 500 errors?
- Response times globally – Is the site fast in Europe but slow in Asia?
- Transaction flows – Can a user search for a product, add it to cart, and complete checkout?
- DNS availability – Are domain records resolving properly from outside networks?
Example:
Suppose your internal monitoring shows everything is green. But external monitoring from Sydney reports that users in Australia can’t access your site. Why? Your CDN (Content Delivery Network) edge node in that region is misconfigured. Without external monitoring, you’d have no idea a whole region of users is locked out.
Optimal check frequency (>1-per-5 min)
Many teams make the mistake of checking uptime once every 10 or 15 minutes. While that may catch major outages, it can easily miss shorter interruptions. A 5-minute outage during checkout might be invisible if you’re only checking every 15 minutes.
The gold standard is checking more than once every 5 minutes. For high-traffic or mission-critical sites (e.g., SaaS dashboards, e-commerce), you might even go down to every 30 seconds.
The tradeoff is cost vs visibility. More frequent checks may use more monitoring credits or API calls, but the benefit of catching small outages early far outweighs the expense.
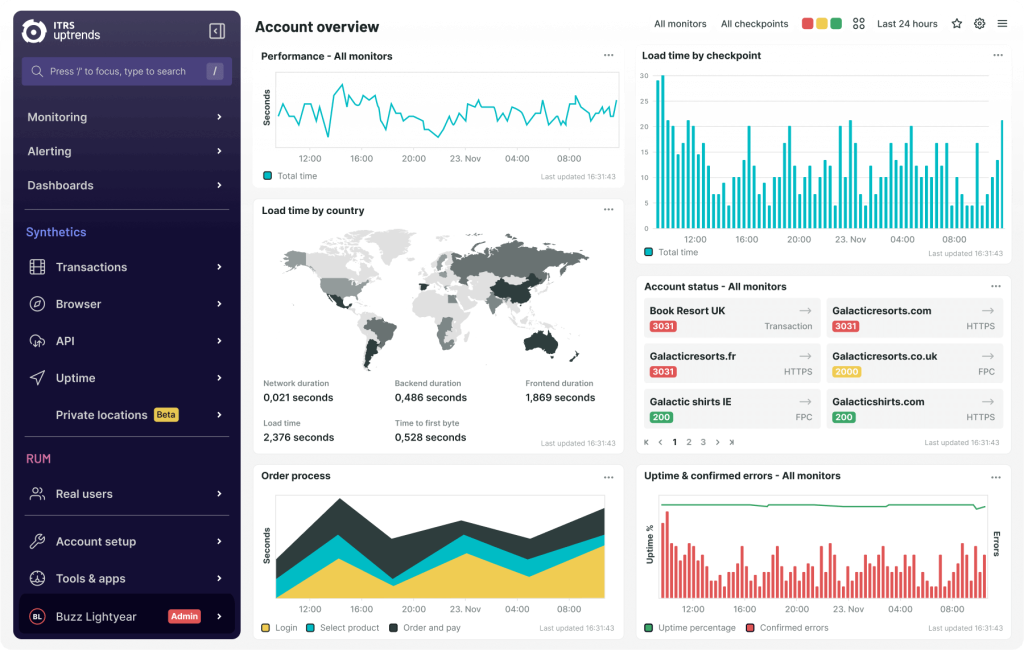
Using Cromojo: real-time alerts, charts
This is where tools like Cromojo shine. Instead of scrambling when something breaks, Cromojo lets you:
- Set up real-time alerts: Get notified instantly via Slack, email, or SMS when your site goes down. No more waiting until a customer complains.
- Visualize uptime trends: Interactive charts help you see if downtime is random or patterned (e.g., always during traffic spikes or server updates).
- Correlate with SEO data: Since Cromojo integrates uptime with domain health metrics, you can spot if technical issues are hurting organic performance.
For marketers, this means confidence when running campaigns. For developers, it means actionable data to troubleshoot and prevent repeat incidents.
Avoid false alarms with threshold baselines
The flip side of fast alerts is alert fatigue. Nobody wants to be woken up at 2 AM because of a single millisecond hiccup.
To prevent this, you need threshold baselines. Instead of firing an alert for every tiny fluctuation, set rules such as:
- Alert only if downtime persists for more than 60 seconds.
- Trigger only after 2 consecutive failed checks.
- Differentiate between full downtime vs slow response times.
For example, if your site response time spikes above 600ms consistently, you might classify it as a warning, not an outright outage. This gives your team actionable alerts, not noise.
Final thoughts
Uptime monitoring isn’t just a technical checkbox, it’s a trust signal for both Google and your customers. By combining external and internal monitoring, setting optimal check intervals, and using tools like Cromojo with smart alerting, you can protect your brand reputation and ensure growth campaigns aren’t wasted on broken links.
👉 Ready to safeguard your site? Try Cromojo for real-time uptime monitoring, SEO insights, and proactive alerts that give you peace of mind.
.png)